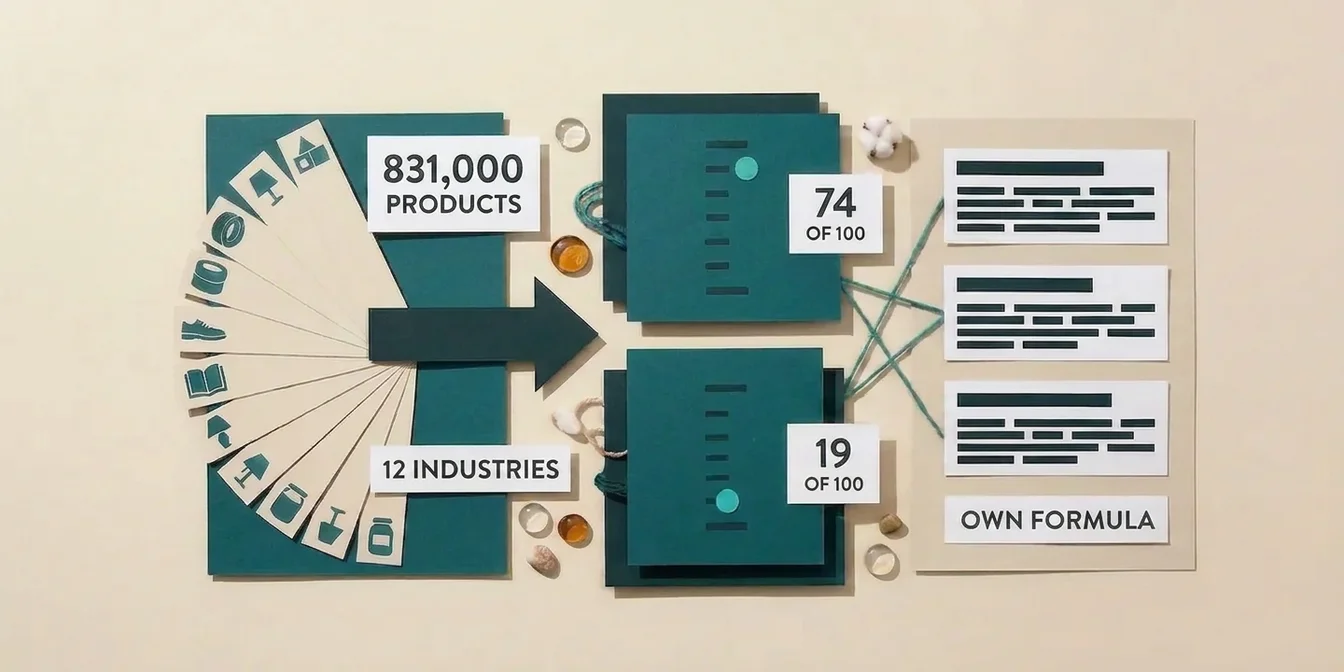
Toys 74, vehicle parts 19: 55 points separate the industries, but most of them crowd the middle
As delivered, before any optimization, the average Google Shopping product scores 20.1 out of 100 quality-score points. Toys reach 74.3, vehicle parts 19.0, and 10 of the 12 industries with at least 1,000 products sit between 23 and 35 points. That's the result of a full census of 831,436 products across 119 feeds and 65 Merchant Centers in the FeedOptimizer.AI database (as of September 3, 2026), which extends this analysis from four industries to every industry in the dataset and shows which title formula works in which segment.
The gap between the best and the worst industry is wide, but it explains less than it seems. Take toys and vehicle parts out of the picture and what remains is a band of roughly 12 points where arts and crafts, sporting goods, apparel, food, and home and garden all crowd together. What really separates feeds is data structure: 35% of all products carry no Google product category at all, 20% of all titles are shorter than 30 characters, and the attribute component of the score averages 6.2 out of 100 across every industry. An industry-specific title formula still helps, but only once the foundation is in place.
Whether your feed sits in the weak or the strong segments takes the free feed check under two minutes to tell you.
Methodology: 831,000 products across every industry, scored as delivered
This analysis scores every feed the way the merchant delivered it to Merchant Center, before any optimization by FeedOptimizer.AI. The basis is the pre-optimization quality score of the FeedOptimizer.AI scoring engine, built from six components: title, description, attributes, product details, Google product category (GPC), and highlights. All figures are aggregated and anonymized; no individual store data is exposed.
| Metric | Value |
|---|---|
| Products analyzed | 831,436 |
| Feeds / Merchant Centers | 119 / 65 |
| Countries / languages | 9 target countries (Switzerland dominant), 5 feed languages |
| Scoring basis | pre-optimization score (feed as delivered) |
| Industry mapping | Google product category, mapped to the top level of Google's taxonomy |
| Categories included | every GPC value with at least 50 products (819,803 products, 98.6%) |
| As of | September 3, 2026 |
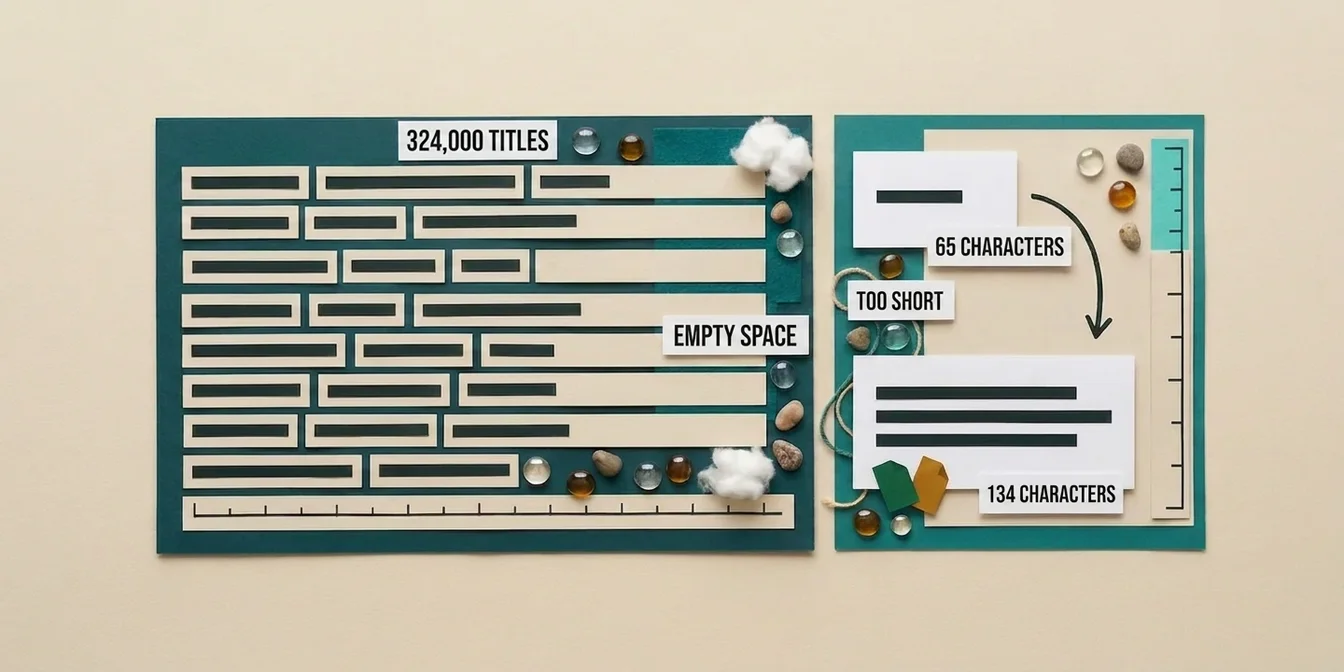
Two things belong in an honest reading of this data. First, the dataset is concentrated: two tire and wheel retailers contribute roughly 263,000 vehicle products between them, and a single WooCommerce feed delivers 145,940 products without any Google product category. Without that one feed, the share of uncategorized products is 21% instead of 35%. Second, the first version of this article from August 28, 2026 differs in scale: it looked at 297,914 already-optimized products across four industries, using the post-optimization score. Today's version measures the raw state of every feed. The numbers are deliberately lower and not comparable to the August figures, but they describe what merchants actually send to Google. We've already covered how much title length alone drives score in our analysis of 324,000 product titles.
The industry ranking: 12 industries with at least 1,000 products
Toys are the only industry where merchants reach more than half the available points as delivered. Every other industry sits below 35, and vehicle parts bring up the rear at 19.0 points despite being the largest industry in the dataset with 266,428 products.
| Industry | Products | Avg. total score | Avg. title score | Avg. attribute score | Avg. title length |
|---|---|---|---|---|---|
| Toys & games | 7,038 | 74.3 | 69.4 | 52.8 | 85 chars |
| Baby & toddler | 5,650 | 34.8 | 42.4 | 27.8 | 39 chars |
| Arts & crafts | 143,732 | 34.1 | 64.3 | 15.4 | 67 chars |
| Office supplies | 1,426 | 33.0 | 43.6 | 29.0 | 43 chars |
| Sporting goods | 41,291 | 32.0 | 49.2 | 4.1 | 53 chars |
| Apparel & accessories | 20,241 | 31.2 | 50.4 | 36.7 | 51 chars |
| Luggage & bags | 1,831 | 30.9 | 37.4 | 18.4 | 35 chars |
| Food & beverages | 6,011 | 30.0 | 51.7 | 2.0 | 53 chars |
| Home & garden | 26,442 | 27.9 | 54.0 | 11.3 | 55 chars |
| Cameras & optics | 3,801 | 24.8 | 65.3 | 0.0 | 67 chars |
| Health & beauty | 1,100 | 23.3 | 28.2 | 26.9 | 23 chars |
| Vehicles & parts | 266,428 | 19.0 | 52.0 | 0.2 | 51 chars |
| No Google product category | 292,668 | 8.1 | 31.4 | 2.5 | 45 chars |
Key insight: According to FeedOptimizer.AI benchmark data from September 2026, the attribute score for toys sits at 52.8 points, well above every other industry; only apparel (36.7) comes close, and all the rest stay below 30. Toy retailers maintain age group, material, and brand in their feeds because their shop systems carry those fields anyway. That attribute maintenance is the difference between 74 and 34 points, not title length by itself: cameras and optics have titles about as long as arts and crafts at 67 characters, but an attribute score of zero, and they land at 24.8.
The table also shows how narrow the middle of the field is. Between baby and toddler (34.8) and cameras and optics (24.8), nine industries fit inside ten points. Benchmarking your feed against "the industry" means benchmarking against a number almost everyone reaches. The question isn't whether your segment looks good or bad, it's which of the six components is structurally missing in your segment.
The foundation is missing: a third without a category, a fifth with short titles
292,668 products, 35% of the entire dataset, carry no Google product category. 36 of the 119 feeds don't supply one for a single product. Those products average 8.1 points; products with a category average 26.6. The missing category costs more than the GPC component itself: in uncategorized feeds, 68.6% of products also lack a brand, versus under 1% overall among products that have a category. Merchants who don't maintain the category usually don't maintain the rest either.
Titles show the same pattern as length:
| Title length | Share of products | Avg. total score | Avg. title score | Avg. attribute score |
|---|---|---|---|---|
| under 30 characters | 20.4% | 11.8 | 23.0 | 3.5 |
| 30 to 50 characters | 33.5% | 15.6 | 32.3 | 5.4 |
| 51 to 70 characters | 27.5% | 21.9 | 54.2 | 6.6 |
| 71 to 100 characters | 13.3% | 31.0 | 82.7 | 8.3 |
| 101 to 150 characters | 5.4% | 42.6 | 99.8 | 14.8 |
More than half of all titles are shorter than 51 characters, and only 5.4% use the 101-to-150-character range where the title score is practically maxed out. Total score climbs with title length from 11.8 to 42.6, but the attribute column stays in the single digits or low double digits in every band. A longer title is a sign of a well-maintained feed; it doesn't replace the attributes.
Vehicle parts: tires and wheels are two different problems
Inside the largest industry, tires score 23.8 and wheels 10.3, even though both categories come from the same two retailers. The cause is different from what the August analysis assumed: not missing vehicle fitment, but simply missing text.
| Category | Products | Avg. total score | Avg. title score | Avg. title length | Titles under 30 chars | No description |
|---|---|---|---|---|---|---|
| Vehicle tires | 167,138 | 23.8 | 67.5 | 67 chars | 0.1% | 5.0% |
| Rims & wheels | 96,275 | 10.3 | 25.0 | 23 chars | 86.7% | 67.2% |
A tire title carries brand, model, dimension, and load index and reaches 67 characters. A wheel title consists of fewer than 30 characters in 87% of cases, typically just manufacturer and part number, and two thirds of wheels have no description at all. Both categories have an attribute score of zero, but tires compensate through title and description, wheels don't. The title formula for vehicle parts therefore has to start differently depending on product type, more on that below.
The apparel paradox, remeasured: same score, opposite causes
Clothing and shoes tie at 31.5 and 31.2 points as delivered, but they get there by opposite routes. In the August analysis of already-optimized products, 38.6 points separated them; the gap only appears through optimization, it doesn't exist in the raw state.
| Category | Products | Avg. total score | Avg. description score | Avg. attribute score | Avg. description length |
|---|---|---|---|---|---|
| Clothing | 14,901 | 31.5 | 47.4 | 49.7 | 477 chars |
| Shoes | 4,803 | 31.2 | 77.3 | 0.3 | 1,328 chars |
Clothing feeds carry size, color, gender, and material as attributes and reach 49.7 attribute points, but their descriptions are short at 477 characters. Shoe feeds describe at length, 1,328 characters on average, but deliver practically no structured attributes. Same total score, entirely different lever: clothing lacks text, shoes lack structure. That clothing ends up well ahead of shoes after optimization fits the picture: an AI can generate more title and description from maintained attributes than from prose with no size or width data.
Industry breakdown: variance within the industry
Within an industry, values sometimes spread more than between industries. The table shows the largest individual categories with at least 1,500 products.
| Google product category | Industry | Products | Avg. total score | Avg. title length |
|---|---|---|---|---|
| Jigsaw puzzles | Toys & games | 2,617 | 75.7 | 88 chars |
| Golf (general) | Sporting goods | 1,538 | 60.3 | 94 chars |
| Art & craft paper | Arts & crafts | 2,998 | 46.2 | 75 chars |
| Art & craft paint | Arts & crafts | 28,953 | 43.5 | 70 chars |
| Golf bags | Sporting goods | 4,292 | 36.2 | 59 chars |
| Golf balls | Sporting goods | 1,777 | 35.1 | 55 chars |
| Painting canvas | Arts & crafts | 4,002 | 34.7 | 78 chars |
| Art brushes | Arts & crafts | 16,424 | 33.9 | 64 chars |
| Golf clubs | Sporting goods | 20,099 | 32.8 | 56 chars |
| Arts & crafts (general) | Arts & crafts | 35,584 | 31.3 | 70 chars |
| Shoes | Apparel | 4,803 | 31.2 | 52 chars |
| Golf gloves | Sporting goods | 3,269 | 29.8 | 56 chars |
| Clothing (general) | Apparel | 13,344 | 29.4 | 50 chars |
| Seeds & seed tape | Home & garden | 9,478 | 27.5 | 63 chars |
| Paint mediums | Arts & crafts | 5,989 | 26.8 | 80 chars |
| Photography | Cameras & optics | 3,801 | 24.8 | 67 chars |
| Vehicle tires | Vehicles & parts | 167,138 | 23.8 | 67 chars |
| Hobbies & creative arts (general) | Arts & crafts | 27,295 | 23.3 | 58 chars |
| Rims & wheels | Vehicles & parts | 96,275 | 10.3 | 23 chars |
Two patterns from the August analysis hold up in the raw data as well. In golf, the generic "Golf (general)" category at 60.3 points still clearly outperforms the specific equipment categories (29.8 to 36.2). And in arts and crafts, the subcategories now spread wider, from 23.3 to 46.2 points: paint and paper lead, while the catch-all categories "Hobbies & creative arts" and "Arts & crafts (general)", where merchants park everything unsorted, trail. As delivered, an unspecific category is a warning sign, not a neutral placeholder.
Title formulas that fit the industry
There is no universal title formula, because different industries have different purchase-decision attributes. We've already written our guide to optimizing Google Shopping product titles with the golden base formula and industry examples. Here are the formulas per segment, derived from what is structurally missing in this dataset:
Vehicle parts: Brand + vehicle fitment + part type + OEM/manufacturer number. Example: "Bosch front brake pads for VW Golf 7 2013-2020, OE no. 5Q0698151". For wheels, add rim size, bolt pattern, and offset directly in the title, because 87% of wheel titles in the dataset are shorter than 30 characters and carry none of these. According to Fullmoon Digital, GTIN, MPN, product_type, and the Google product category are among the most important supporting attributes.
Golf equipment: Brand + model + club type/equipment type + core attribute (shaft flex, handicap range, size). Golf club titles average 56 characters, far shorter than the generic golf category (94 characters), and that's exactly where shaft or loft usually goes missing.
Apparel: Brand + gender + material/attribute + product type + color + size for clothing. For shoes, add size, width, and fit as structured attributes, because shoe feeds in the dataset deliver practically none of them (0.3 attribute points) even though the descriptions often contain them.
Arts & crafts: Product type + brand + material + quantity/size + color. The industry has the second-best titles in the dataset at 64.3 title points but loses ground on attributes (15.4) and catch-all categories.
Toys: Brand + product type + series/theme + age recommendation + piece count. The industry is the proof that the formula works: 85 characters on average, attributes maintained, 74.3 points as delivered.
What this means for your store
- Check category and attributes first, then the title. 35% of all products in the dataset have no Google product category, and the attribute score sits below 40 in 11 of 12 industries. Both cost more points than any single title fix.
- Benchmark against your subcategory and the right component. Clothing and shoes share the same total score and have entirely different problems. Look at which of the six components is structurally missing in your segment, not at the industry average.
- Short titles are a symptom. 20% of all titles are shorter than 30 characters and average 11.8 points. Where the title is that short, description and category are usually missing too, as the wheels example shows.
How FeedOptimizer.AI adapts title formulas by industry
A golf glove formula doesn't work for a brake pad, and a shoe formula doesn't work for a paintbrush. FeedOptimizer.AI detects the product category of every item and adjusts title structure, attribute selection, and description accordingly, instead of laying one formula across the entire feed. In the segments where our data shows the widest gap between title score and total score, such as cameras and optics or vehicle tires, that's what makes the difference: the AI fills in missing attributes and the Google product category from the available field data instead of silently leaving them empty. The optimized titles go into Merchant Center as a supplemental feed; your original feed stays untouched. Pricing is based on product count, not industry.
Frequently Asked Questions
Which industry has the lowest Google Shopping quality score?
According to our September 2026 census, vehicle parts have the lowest quality score of any industry with at least 1,000 products at 19.0 out of 100, below health and beauty (23.3) and cameras and optics (24.8). Only products with no Google product category at all score lower, at 8.1 points.
Why do vehicle parts perform so poorly on Google Shopping?
The figure is dragged down by rims and wheels: 96,275 products with an average title length of 23 characters, 87% of them under 30 characters, and two thirds without a description. Tires from the same retailers reach 23.8 points with 67-character titles. The attribute score is zero in both categories.
Do all industries need the same title formula?
No. Our data shows a 30-point spread in golf between golf gloves (29.8) and the generic golf category (60.3), and a 23-point spread in arts and crafts between catch-all categories (23.3) and art and craft paper (46.2). Every industry needs its own formula, sometimes down to the subcategory within an industry.
Why do shoes and clothing share the same score when their descriptions are so different?
Shoes carry descriptions almost three times as long as clothing (1,328 vs. 477 characters) but an attribute score of 0.3 versus 49.7. Clothing offsets short text with maintained attributes; shoes offset missing attributes with text. As delivered, both land at around 31 points.
What does the quality score measure beyond the title?
The quality score is built from six components: title, description, attributes, product details, Google product category, and highlights. A good title score therefore says nothing about the total score, as cameras and optics show (title 65.3, attributes 0.0, total just 24.8).