How good is the average Google Shopping feed, really?
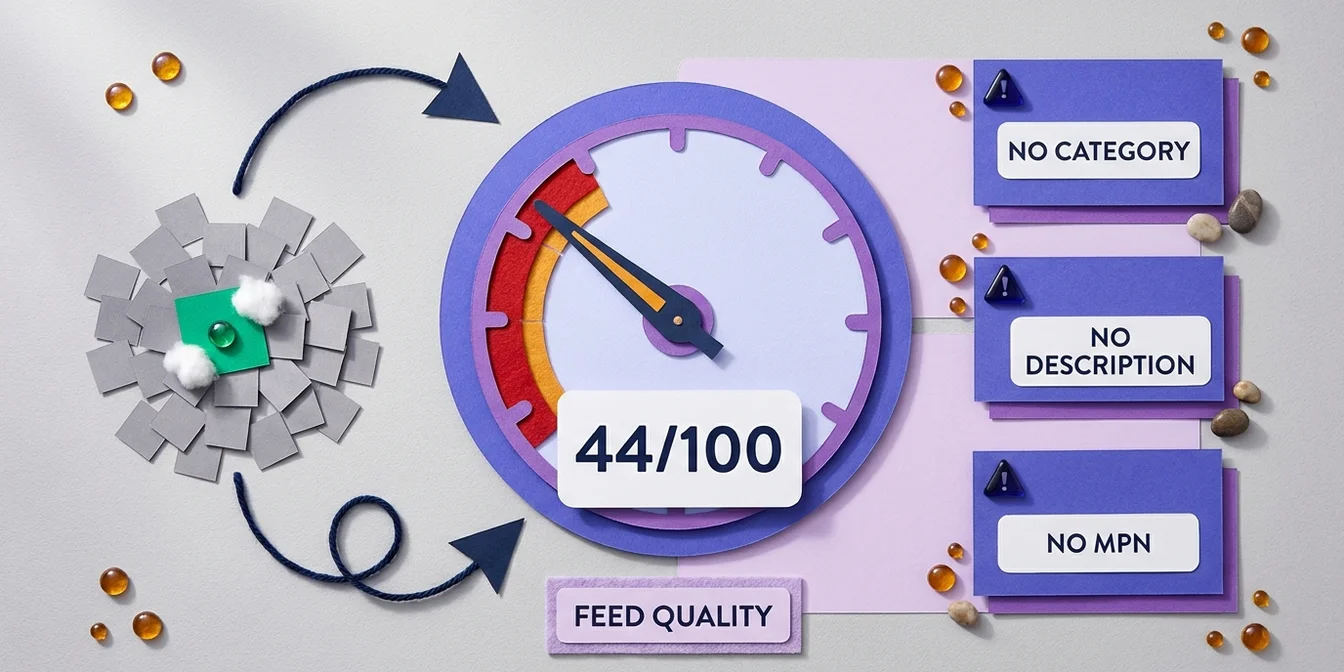
In our feed error benchmark, the average Google Shopping feed scores just 44 out of 100 on the feed quality score. That's the result of analyzing 496,603 products across 252 feeds that we evaluated at FeedOptimizer.AI across every industry. Put differently: more than half of all products would fail if this were a school grade.
What's alarming isn't the average itself: it's how it forms. It's not that every feed is mediocre. Instead, there's a wide gap: a small group of excellent feeds sits opposite a large mass of critically weak ones. That weak majority burns ad budget every single day, because Google ranks those products lower in the auction.
This benchmark uses real numbers to show which feed errors occur most often, how costly they are statistically, and where the biggest lever sits. No estimates, no industry folklore: just aggregated, anonymized data from half a million products.
The one number this benchmark cannot give you is your own. The free feed check runs the same scoring engine over your feed and returns a score per product plus the concrete weaknesses behind it, so you can see whether you sit above or below the 44 out of 100 that the average feed manages.
Methodology: What this benchmark is based on
This analysis is based on 496,603 products across 252 Google Shopping feeds, evaluated by FeedOptimizer.AI's scoring engine. All data reflects aggregated, anonymized benchmarks. No individual store data is exposed.
| Metric | Value |
|---|---|
| Products analyzed | 496,603 |
| Feeds included | 252 |
| Countries | 20 |
| Languages | 6 |
| Analysis period | June 2026 |
One note in the interest of transparency: GTIN completeness can't be measured reliably from the aggregated dataset and is therefore excluded from this benchmark. Every other required and recommended attribute is fully captured.
The score distribution: more than half of products fail
51 percent of all analyzed products score below 50 out of 100. They land in the critical or poor range. Only 18.3 percent make it into the top tier (70 points or more). That's the central finding of this benchmark: weak feed quality isn't the exception, it's the norm.
| Quality tier | Score range | Share |
|---|---|---|
| Excellent | 90–100 | 6.2% |
| Good | 70–89 | 12.1% |
| Fair | 50–69 | 30.6% |
| Poor | 30–49 | 14.3% |
| Critical | 0–29 | 36.8% |
Key insight: According to FeedOptimizer.AI benchmark data from June 2026, 36.8 percent of all Google Shopping products fall into the "Critical" tier (0–29 points), almost one in three. These products are systematically disadvantaged in Google's auctions: lower placement, reduced impression share, higher effective cost per click. The median sits at 48.8 points, and the lower quartile (p25) at just 13.8. In other words, a quarter of all products are effectively invisible in the Shopping competition, even though budget is being spent on them.
The high standard deviation of 28.9 points confirms the polarization: there are a few very strong feeds and many very weak ones, with little middle ground. Simply lifting your feed above the median already overtakes half the competition.
The most common feed errors in detail
The most common feed error is a missing Google product category: it's absent on 16.8 percent of all products, roughly one in six. Missing descriptions and missing MPNs follow. Together, these three errors account for the bulk of weak scores.
| Feed error | Products affected | Share |
|---|---|---|
| Missing Google product category | 83,564 | 16.8% |
| Missing product description | 74,599 | 15.0% |
| Missing MPN | 72,584 | 14.6% |
| Missing brand | 32,547 | 6.6% |
| Missing product image | 1,372 | 0.3% |
Error 1: Missing product category (16.8%)
The google_product_category tells Google which market your product belongs to. When it's absent, Google guesses. Often wrong. A hiking boot ends up under "Shoes" instead of "Outdoor Footwear," competes against the wrong products, and shows up for the wrong queries. On 16.8 percent of products, the merchant leaves that decision to chance. It's the most expensive of the common errors, because it cuts visibility off at the root.
Error 2: Missing description (15.0%)
On 15 percent of products, the description is missing entirely. That matters, because the description drives which search queries your product shows up for at all. In the combined title-and-description analysis, "title too short + description missing" was the single most common problem pairing, at 46,395 products. Another recurring pattern: descriptions with embedded HTML code, which Google partly ignores and partly flags as an error. For how to structure descriptions cleanly, see our guide to optimizing product descriptions.
Error 3: Missing MPN (14.6%)
The MPN (Manufacturer Part Number), alongside brand and GTIN, is part of a product's unique identification. When it's missing on 14.6 percent of products, it makes it harder for Google to match your product unambiguously against its catalog, especially when there's no GTIN either. The result is "Limited Performance" warnings and weaker auction participation. For a comprehensive list of avoidable classics, see our guide to the most common Google Shopping feed errors.
The product image, incidentally, is the bright spot: only 0.3 percent of products have no image at all. Most merchants get the obvious right, but they fail on the invisible attributes.
Title quality: a third are too short
One in three product titles (33.1 percent) is too short or far too short. The average title score, at 72.9 points, sits above the overall average (titles are the least-neglected discipline), but a third still leaves reach on the table, because short titles carry too few relevant keywords.
| Title rating | Share |
|---|---|
| Excellent | 59.4% |
| Too short | 21.4% |
| Short | 11.7% |
| Acceptable | 5.4% |
| Too long | 2.1% |
A short title like "Salomon X Ultra 4" leaves 60+ characters unused, characters that could carry purchase-deciding attributes: gender, color, material, intended use. Fill the available space with relevant terms (e.g., "Salomon X Ultra 4 GTX Men's Waterproof Hiking Shoes Gray") and you get found for far more queries. For how to build titles methodically without slipping into keyword stuffing, see our guide to product title optimization.
What this data means for your store
The good news: because so many feeds are weak, competition for the good spots is surprisingly thin. Three concrete steps close most of the gap:
- Set a product category for every product: the most common error (16.8%) and, at the same time, the one with the biggest visibility lever. Never let Google guess.
- Fill every description, cleanly and without HTML: closes the most common problem pairing (short title + missing description) and improves query matching.
- Expand titles to 100–150 characters with relevant attributes: a third of all titles are too short; this is fast-won reach with no budget increase.
The financial effect is direct: better feed quality improves CTR, conversion rate, and impression share at the same time, without touching your daily budget. For how that flows through to the bottom line, we run the numbers in How to calculate Google Shopping ROI.
How FeedOptimizer.AI fixes these feed errors
The three top errors from this benchmark are exactly what FeedOptimizer.AI fixes automatically. The AI assigns the correct Google product category to every product, generates complete, HTML-free descriptions, and expands titles with the purchase-relevant attributes, across the entire feed, in minutes instead of weeks.
The trick: you test the optimized data risk-free through a supplemental feed before anything goes live. Your original feed stays untouched, and you measure the effect cleanly against a control group. To see how much of this is included in each plan, check the pricing overview.
Frequently Asked Questions
What is a good feed quality score on Google Shopping?
According to FeedOptimizer.AI benchmark data from June 2026, the average is just 44 out of 100, with a median of 48.8. Anything above 70 already counts as the top tier (only 18.3 percent of products get there). Aim for a score of 70+: that overtakes roughly four-fifths of the competition.
Which feed error is the most common?
A missing Google product category is the most common feed error, at 16.8 percent. It affects roughly one in six products. Missing descriptions (15.0%) and missing MPNs (14.6%) follow. Product images, by contrast, are rarely missing (0.3%), because they're the most obvious mandatory element.
How many products have a critical feed score?
36.8 percent of all analyzed products fall into the "Critical" tier (0–29 points), almost one in three. Add the "Poor" range (30–49 points) and 51.1 percent sit below the 50-point mark. These products are systematically served worse in Shopping auctions.
Are short titles a common problem?
Yes. 33.1 percent of all product titles are too short or far too short. They don't use the available space for purchase-relevant keywords and therefore get found for fewer queries. The average title score is a solid 72.9 points, but a third needlessly leaves reach on the table.
What data is this benchmark based on?
On 496,603 products across 252 Google Shopping feeds in 20 countries, evaluated in June 2026 by FeedOptimizer.AI's scoring engine. All values are aggregated and anonymized. No individual store data is exposed. GTIN completeness is excluded for methodological reasons.
Conclusion: weak feeds are the rule and your opportunity
The most important finding of this benchmark isn't that feeds are bad, but how bad the average is: 44 out of 100, with more than half of products below the failing line. Above all, that means one thing: the effort to reach the top tier is smaller than most people think.
The 4 key takeaways:
- 44/100 is the average: the median is 48.8. Reach 70+ and you're in the top 18 percent.
- A missing product category is the most common error (16.8%) and, at the same time, the most expensive in terms of visibility.
- Description and MPN follow close behind (15.0% and 14.6%): both weaken query and catalog matching.
- A third of titles are too short: fast-won reach with no budget increase.
Weak feed quality is the norm. That's exactly why a clean feed is the cheapest competitive advantage you can buy in Google Shopping.