The average Google Shopping feed scores 55.9 out of 100
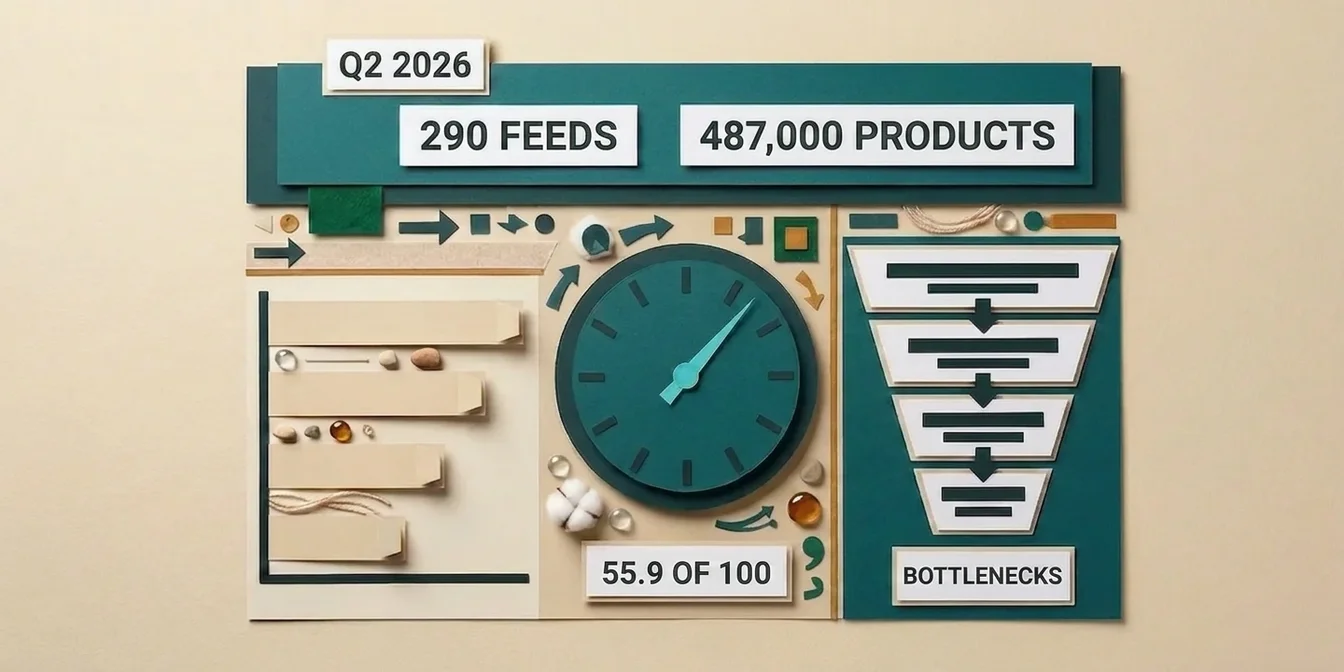
Across 290 feeds and 487,000 products, the average Quality Score sits at 55.9 out of 100. That's the headline number from our Q2 2026 dataset, and it explains why so many Shopping campaigns underperform: the feed behind them is, on average, only half-maintained.
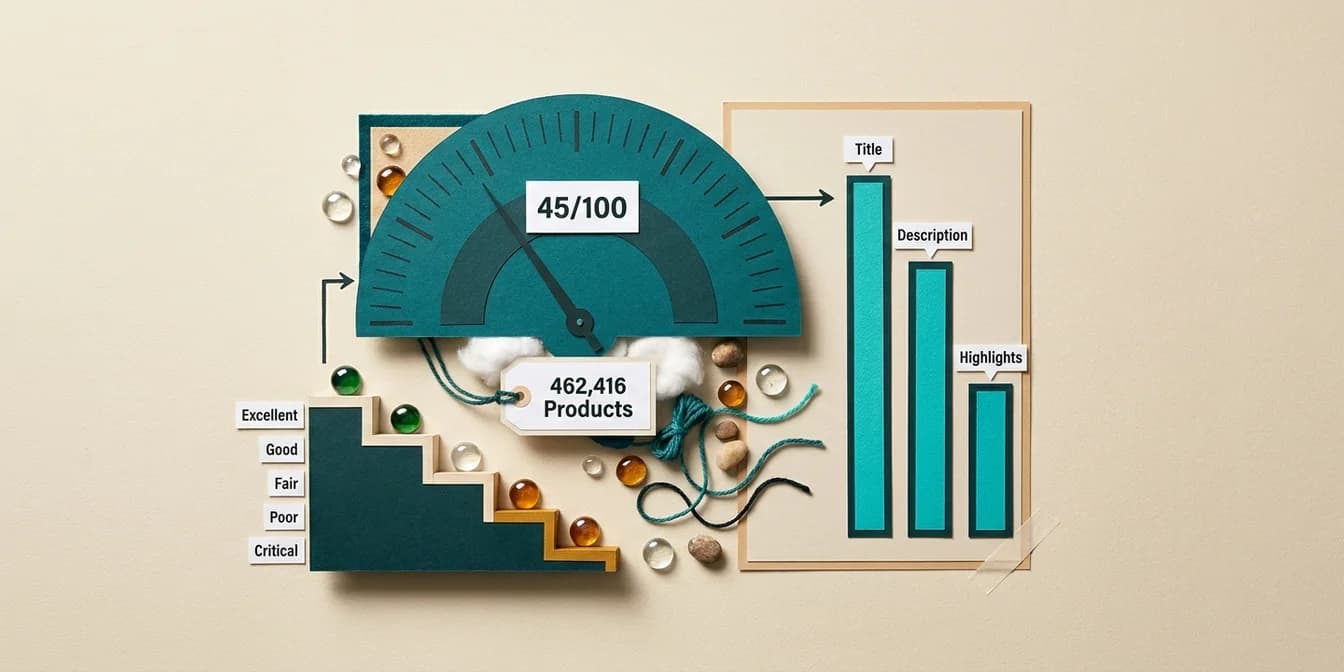
The most telling part is the gap between fields. Titles average 79.5 points, descriptions climb to 88.1. Yet the composite score drops to 55.9, because attributes, GPC categorization, and product details drag the average down. A feed can have solid copy and still be structurally broken.
Methodology: where this data comes from
This report is built on 487,355 products across 290 active Google Shopping feeds in 23 countries and 7 languages, scored by FeedOptimizer.AI's scoring engine in July and August 2026. Every number is aggregated and anonymized; no individual merchant's data can be reconstructed from this report.
| Metric | Value |
|---|---|
| Feeds tracked | 290 |
| Products in dataset | 487,355 |
| Countries | 23 |
| Languages | 7 |
| Period | July/August 2026 |
One honest caveat up front: this dataset skews heavily toward the DACH region (Germany, Austria, Switzerland), and specifically Switzerland. 117 of the 290 feeds (40%) are Swiss, but they account for 445,282 of 487,355 products, roughly 91% of total catalog volume. Germany comes second with 25 feeds but only 1,282 products. So the patterns here mostly describe mid-market DACH e-commerce, not a globally even sample. That lines up with an independent data point: the FHNW Online Retailer Survey 2025 (8th edition, 643 retailers, 581 of them Swiss) found that 66% of respondents already generate product descriptions with AI, another sign of how widespread AI-assisted content creation has become in Swiss e-commerce.
Where the Quality Score actually gets lost
The status breakdown shows the scale of the problem. Of 174,393 scored products in our most recent scoring window, 26.3% are flagged critical, 32.8% carry a warning, and only 40.9% are good.
| Status | Share | What it means |
|---|---|---|
| Critical | 26.3% | Missing required fields, GPC, GTIN, or a title under minimum length |
| Warning | 32.8% | Partially filled, gaps in attributes or product details |
| Good | 40.9% | Complete, score above target |
Nearly six in ten products in this dataset sit at critical or warning. Titles and descriptions tend to be the least broken part of a feed because they're the most visible. Attributes like color, material, GPC category, or product details get overlooked far more often, and they cost just as much visibility in the Google Shopping auction. FeedOptimizer.AI benchmark data, August 2026.
If your own "critical" rate needs work, the seven most common feed errors tend to cluster around the same handful of causes: missing GTIN, incomplete categories, stale pricing.
The optimization funnel: where feeds stall on the way to GMC
Only 52.9% of products in this dataset have ever run through an AI optimization pass. That means nearly half of the average feed is still shipping into the Google Shopping auction with original manufacturer copy or an untouched store export.
From optimized product to approved upload
| Step | Products | Share of catalog |
|---|---|---|
| Full catalog | 487,355 | 100% |
| Title/description AI-optimized | 257,906 | 52.9% |
| Approved in Workbench review | 94,315 | 19.4% |
Of the 257,906 optimized products, only 94,315, or 36.6%, make it through manual approval to upload. Two out of three optimized products stall in review, usually because teams delay approval, not because the AI suggestions are weak. That's the quiet bottleneck in most setups, the same dynamic behind many Merchant Center disapprovals: optimization isn't the limiting factor, human review capacity is.
Why feed quality matters more in 2026, not less
Performance Max used to have a reputation as a black box where feed quality barely mattered. The data says otherwise. According to a Smarter Ecommerce analysis of more than 4,000 PMax campaigns across 500+ advertiser accounts, feed-based Shopping inventory accounts for a median 90% of PMax spend. At the same time, PMax's share of total ad cost has fallen from its peak of roughly 82% (May 2024) by an average of 0.65 percentage points per month, about 6 points in total by early 2025, down to roughly 76%, as advertisers pulled some control back toward more targeted campaign types.
The takeaway: feed quality isn't losing leverage as PMax automates more. It's gaining leverage, because advertisers are scrutinizing which campaign types actually work, and a weak feed shows up faster under that scrutiny.
What this means for your feed
- Check attributes and GPC before titles. The data shows titles (79.5) and descriptions (88.1) are rarely the problem. The composite score usually tips over on missing or wrong attributes and Google Product Category.
- Build approval capacity for optimization suggestions. With a 36.6% approval rate, review is the bottleneck, not content generation. A fixed weekly slot for Workbench review extracts more value from optimization spend you've already made than running another optimization pass.
- Optimize the rest of the catalog, not just bestsellers. 47% of products in this dataset have never been optimized. Long-tail products with weak scores lose a disproportionate share of Performance Max impression share.
How FeedOptimizer.AI helps
FeedOptimizer.AI calculates this exact Quality Score for your own feed, using the same scoring logic behind this report: title, description, attributes, GPC category, and product details, each weighted individually. The AI suggests concrete fixes per product, you review them in Workbench before anything reaches Google, and you keep full control over every approval. No more manually tracking thousands of rows in a spreadsheet, just a dashboard that shows exactly where your feed stands today and what to fix next for the biggest impact.
and see in minutes where your feed lands against the industry averages in this report.
Frequently Asked Questions
What's a good Quality Score for a Google Shopping feed?
Based on our Q2 2026 dataset, the industry average is 55.9 out of 100. Scores above 75 are solid, above 90 are excellent. Only 40.9% of scored products in the dataset currently reach "good" status.
My title score is high, but my overall score is still low. Why?
Titles (avg. 79.5) and descriptions (avg. 88.1) are consistently the strongest individual scores in the dataset. The composite score also weighs attributes, GPC categorization, and product details, and that's exactly where the data shows the biggest gaps.
How many Google Shopping products are actually being optimized with AI right now?
52.9% of the 487,355 products in this dataset have run through at least one AI optimization pass. The rest are still running on unmodified original or manufacturer copy.
Why don't all optimized products get uploaded?
Only 36.6% of optimized products make it through manual approval (Workbench review) to upload. In practice, the bottleneck is usually review capacity on the merchant's team, not the quality of the AI's suggestions.
How often is this report updated?
This state-of report runs on live data from the FeedOptimizer.AI scoring engine and gets refreshed quarterly with new numbers, so the benchmarks keep pace with how the market actually moves.