How does your store actually rank on the feed quality score?
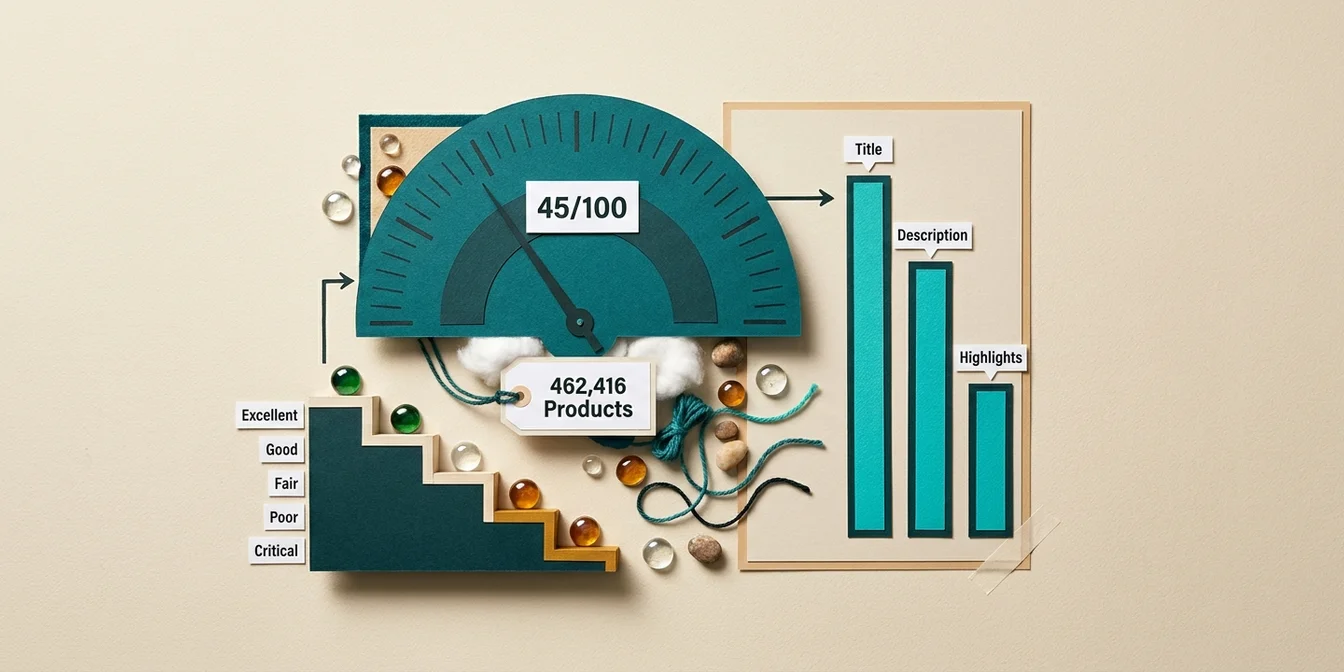
The average feed quality score across 462,416 products sits at just 45 out of 100. That's the finding from our latest Feed Quality Score Benchmark at FeedOptimizer.AI, measured across products from 308 feeds in 23 countries. More than half of all products score below 50, while titles come in nearly 19 points stronger than product highlights.
The feed quality score summarizes how well a product is prepared for Google Shopping: title, description, and product highlights feed into it with different weights, alongside other field groups like product details, category depth, and attributes. It's not a vanity grade. It correlates with visibility and auction participation, because Google relies on exactly this product data for matching.
Wondering where your own store lands in this distribution? The free feed check runs the same score against every product in your feed and shows you which component is dragging it down.
Methodology: Where this data comes from
This analysis is based on 462,416 products with a current feed quality score, drawn from a total pool of 856,147 synced products across 308 Google Shopping feeds in 23 countries and 7 languages. What gets scored is the raw state of the feed as it arrives at sync, not the result after optimization. All figures are aggregated and anonymized; no individual store data is exposed.
| Metric | Value |
|---|---|
| Products with a current score | 462,416 |
| Feeds in the dataset | 308 |
| Countries | 23 |
| Languages | 7 |
| Snapshot date | September 2026 |
The dataset skews toward the DACH region (Germany, Austria, Switzerland), supplemented with feeds from the rest of Europe and overseas. Not every synced product carries a score yet, since the scoring engine only runs after a product's first sync. The 462,416 scored products are the reliable subset this benchmark is built on.
Feed quality score distribution: more than half fall below 50
51.2 percent of all scored products come in below 50 out of 100. Only 22.5 percent hit 70 or above, the zone where a product competes credibly in the Shopping auction. The median sits at 48.8, confirming that a mediocre score is the norm, not the exception.
| Quality tier | Score range | Share | Products |
|---|---|---|---|
| Excellent | 90-100 | 6.1% | 28,349 |
| Good | 70-89 | 16.4% | 75,857 |
| Fair | 50-69 | 26.2% | 121,392 |
| Poor | 30-49 | 11.5% | 53,310 |
| Critical | 0-29 | 39.7% | 183,508 |
Key finding: According to FeedOptimizer.AI benchmark data from September 2026, nearly two in five products (39.7 percent) fall into the "Critical" tier at 0 to 29 points. The bottom quartile sits at just 18.2 points, while the top quartile reaches 67.5. That nearly 50-point gap between p25 and p75 points to a heavily polarized distribution: not a broad middle class, but a large weak group next to a small strong one. The standard deviation of 28.2 points confirms it. Push your own store to just the median of 48.8 and you already outrank half of the products in this dataset.
That polarization is the real story behind the average of 45. It hides the fact that a small share of stores are nearly dialed in, while the majority sit stuck in the critical zone.
Title, description, highlights: where stores actually leave points on the table
Titles are the strongest component at 74.2 points; product highlights are the weakest at 55.5. Almost 19 points separate the two fields, a gap that shows up directly in the overall score because highlights carry their own weight in the calculation.
| Component | Average score |
|---|---|
| Title | 74.2 |
| Description | 74.8 |
| Product highlights | 55.5 |
| Overall (weighted) | 45.0 |
Titles and descriptions get most of the attention when stores maintain a feed. They're visible right in the Shopping listing, which makes them the obvious target. Product highlights (product_highlight) tend to just ride along, rarely filled in on purpose. The score reflects exactly that: a field nobody watches doesn't get maintained either. For a systematic way to build titles without falling into keyword stuffing, see our guide to optimizing Google Shopping titles. The same logic applies to descriptions, covered in the guide to Google Shopping product descriptions.
Title and description together: the most common failure combo
For 195,955 products, 42.4 percent of the entire dataset, title and description are both rated "Excellent" at the same time. On the other end sits the most common problem combination: 40,028 products (8.7 percent) have a title that's too short and a description that's missing entirely. Another 20,906 products (4.5 percent) combine a too-short title with a description containing embedded HTML, which Google sometimes ignores and sometimes flags as a formatting error.
These clusters show that feed problems rarely show up in isolation. A store that neglects its titles usually neglects its descriptions too. Fixing both at once moves the score far more than tackling either one alone.
Industry comparison: how much the score swings by category
Average feed quality scores swing between 23.4 and 89.0 points across Google product categories. That's a 65.6-point spread driven purely by the industry a store sells in. Vehicles & Parts, the largest category in our dataset at 183,645 products, sits at 41.8, slightly below the overall average: titles do reasonably well at 68.1, while descriptions land at 56.7, noticeably weaker than the overall description average of 74.8.
That wide spread between industries confirms a "good" score only really means something in the context of your own category. A spare-parts retailer at 55 might be beating its industry average, while a fashion retailer at the same score is falling well behind. Because many Google product categories in our dataset only resolve to a numeric ID rather than a readable name, we're publishing the verified range here instead of naming individual categories we can't reliably attribute.
What this means for your store
Three levers deliver the biggest return per hour invested, based on this data:
- Fill in product highlights first. It's the weakest component (55.5) and the most neglected. Four sharp bullet points per product often lift this score in a single pass.
- Check title and description together, not separately. The most common problem combo hits 8.7 percent of all products in both fields at once. Fix only the title and you leave half the gain on the table.
- Aim for 70+, not 100. That's already the threshold for the top 22.5 percent. The last stretch from 90 to 100 costs disproportionately more effort for comparatively little added visibility.
The link between score and performance isn't abstract. Google uses exactly this product data to match and rank products in the Shopping auction. A weak score means weaker matching, regardless of ad budget.
How FeedOptimizer.AI closes these gaps automatically
FeedOptimizer.AI targets exactly the three weakest points from this benchmark. The AI generates complete product highlights from your existing product data, builds descriptions free of leftover HTML, and expands short titles with the attributes buyers actually search for, across the entire feed at once instead of product by product by hand.
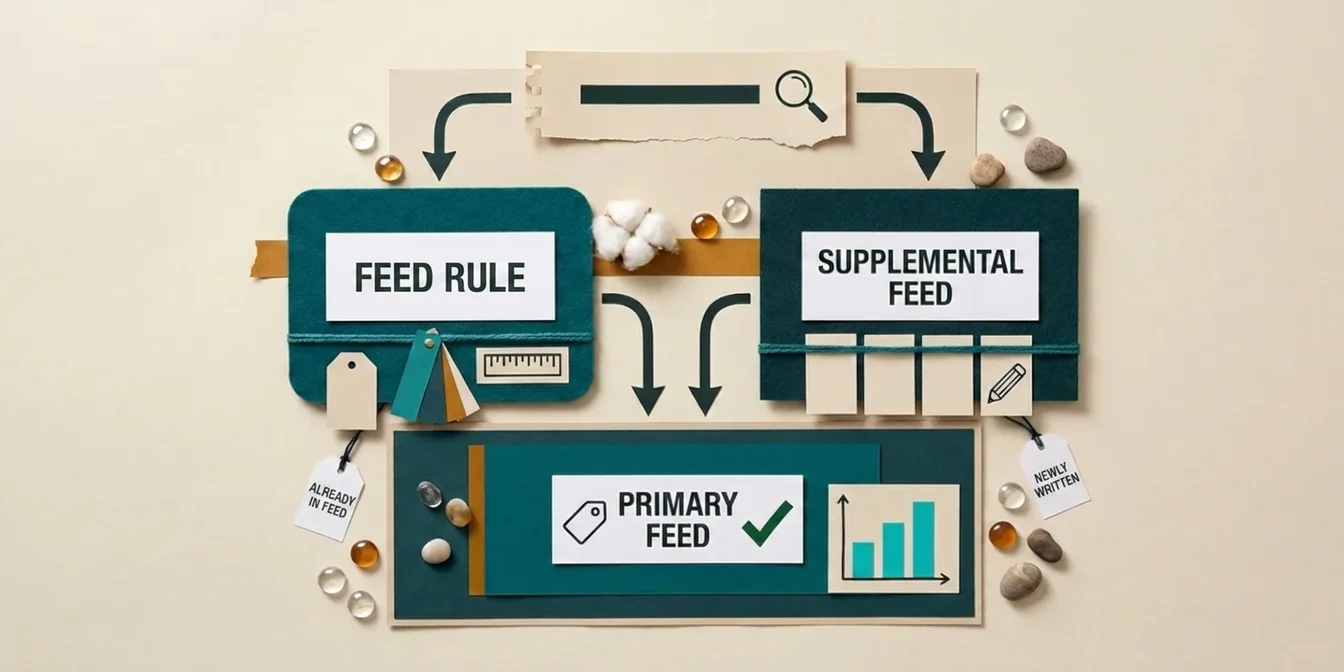
Before anything goes live, optimization runs through a supplemental feed: your original feed stays untouched while you preview the new score first. For the GMC attributes that feed into the score and the required fields behind them, see our guide to Google Shopping feed attributes. For the feed errors that drag the score down alongside this, check our feed error benchmark. To see which plan fits your feed size, visit our pricing page.
Frequently Asked Questions
What is a good feed quality score?
According to our September 2026 benchmark, a score of 70 or above puts a product in the top 22.5 percent. The average sits at just 45, the median at 48.8. Only 6.1 percent of all scored products currently reach 90 or higher.
Which feed component has the weakest score?
Product highlights score the lowest at an average of 55.5, almost 19 points behind title (74.2) and description (74.8). Most stores overlook this field while building their feed, since it's less visible in the listing itself than title or description.
How many products have a critical feed score?
39.7 percent of all 462,416 scored products fall into the "Critical" tier at 0 to 29 points. Combined with the "Poor" tier (30 to 49 points), 51.2 percent of all products sit below the 50-point mark.
Is the feed quality score the same as Google's own store quality?
No. Google's Store Quality program rates a store's overall shopping experience (shipping, returns, browsing, and purchase) on a scale from "Low" to "Exceptional". FeedOptimizer.AI's feed quality score instead measures the data quality of individual products in the feed, independent of the store experience.
Why does the score vary so much between industries?
Across the categories in this benchmark, the average score ranges from 23.4 to 89.0. The gap usually traces back to the feed source: industries with lots of structured manufacturer data, like spare parts with standardized part numbers, start from better raw data than industries that rely on free-text descriptions.
Conclusion: the average is misleading, the distribution isn't
45 out of 100 sounds like a solid middle ground. The actual distribution tells a different story: a small group of very strong feeds sitting next to a large mass of critically weak ones, with product highlights as the consistently weakest link.
The 4 key takeaways:
- 45/100 is the average across 462,416 products, with a median of 48.8. Score 70 or above and you're in the top 22.5 percent.
- Product highlights are the weakest component (55.5), almost 19 points behind title and description.
- Title and description often fail together: 8.7 percent of all products combine a too-short title with a missing description.
- Industry accounts for up to a 65.6-point swing: a score only really means something when read against your own category.
The cheapest lever rarely sits where the most attention goes. In this benchmark, that's product highlights: the field that costs the least effort for the biggest jump in score.